Chloride, carbonation and remaining life: how coastal concrete ages
Near the sea, concrete rarely fails all at once. It ages from the surface inward, and the most useful question is how long the rebar still has.
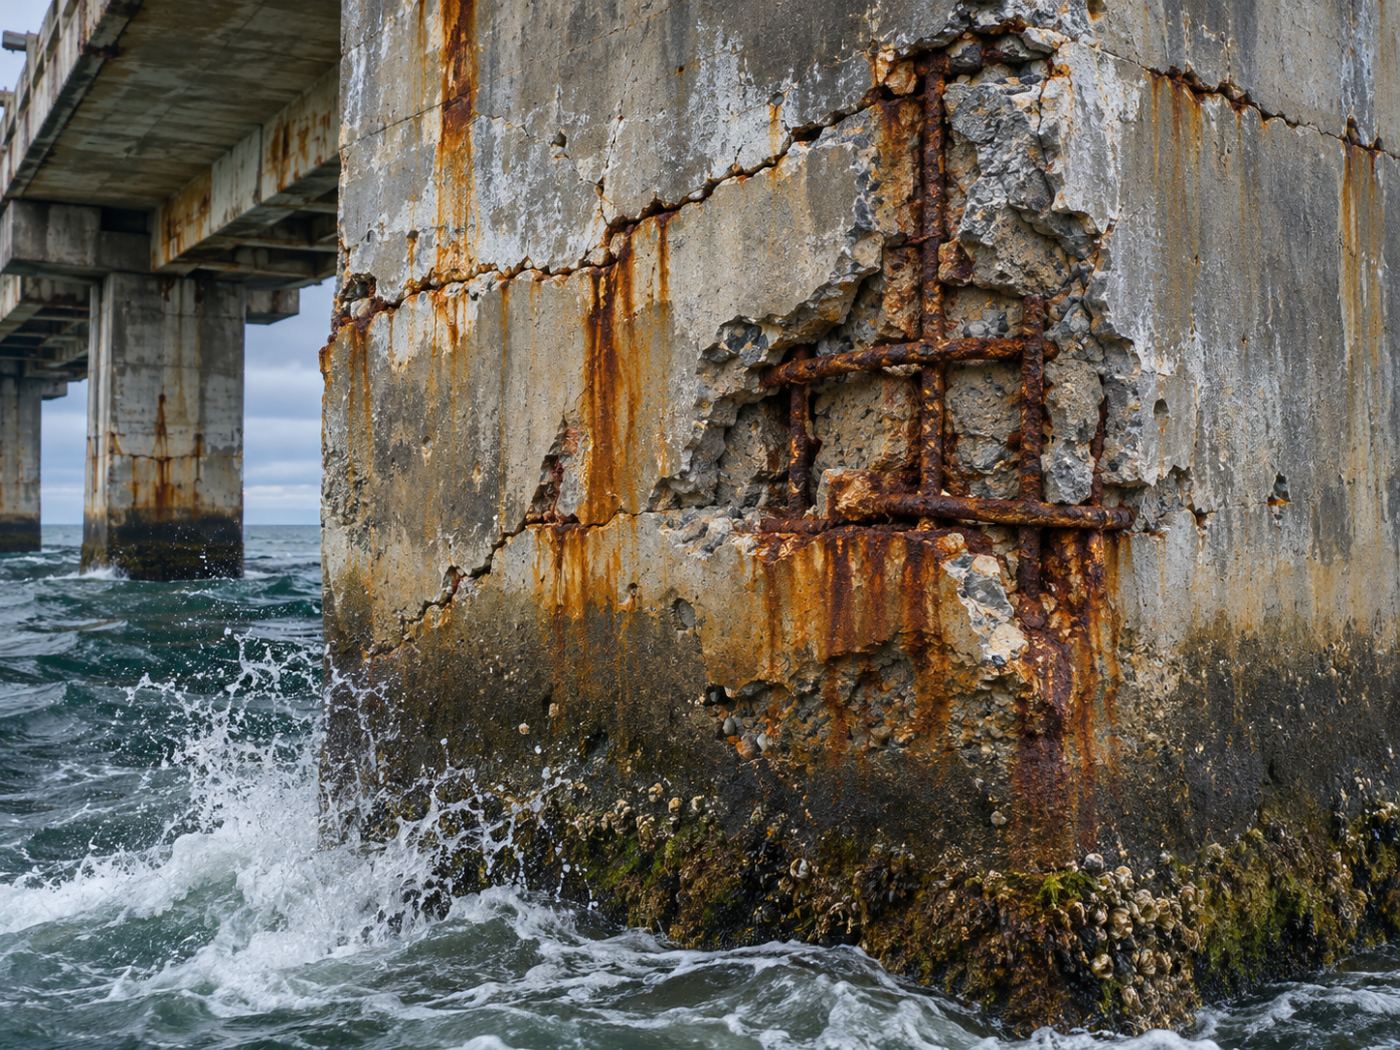
Reinforced concrete protects its steel in two ways: a layer of cover, and a highly alkaline environment that keeps the steel passive. Chloride and carbonation attack both. Once they reach the rebar, corrosion can start, rust takes up more volume than steel, and the cover eventually cracks.
This happens slowly and out of sight. By the time rust stains appear, much of the remaining life may already be used. That is why engineers model it, and why the inputs and their uncertainty matter so much.
Below we explain the two mechanisms, the stages of damage, and how PILLAR expresses remaining life as a range instead of a single date.
Category: Technology
Chloride and carbonation reach the rebar in different ways
Chloride comes from seawater, salt spray and de-icing salt. It diffuses into the concrete, and once the concentration at the rebar passes a critical value, the protective layer on the steel breaks down. Engineers usually model this with Fick’s second law of diffusion, using a diffusion coefficient and a surface chloride level that depend on the concrete and its exposure.
Carbonation comes from carbon dioxide in the air. It lowers the alkalinity of the concrete from the surface inward, roughly with the square root of time. When the carbonation front reaches the rebar, the steel loses its protection. The fib Model Code 2010 describes widely used models for both mechanisms.
How chloride-induced damage develops
Salt spray and splash reach the surface.
Chloride diffuses through the cover.
Chloride at the rebar passes the critical value.
Corrosion products build up around the steel.
The cover cracks; repairs become larger.
Simplified sequence. Carbonation follows a similar path with a carbonation front instead of chloride.
Climate, cover and concrete quality drive the timeline
The same concrete ages differently in different places. Warmer, wetter sites speed up diffusion and corrosion; more freeze–thaw cycles damage the surface; distance to the sea changes the chloride load. Thicker cover and denser concrete slow everything down.
PILLAR takes temperature, humidity, rain and freeze–thaw cycles from ERA5 for each site, and the structure’s year built, concrete strength, cover and distance to the sea from the owner. Where those values are unknown, it starts from defaults for the structure type and says so.
Remaining life is a range, so we show p10, p50 and p90
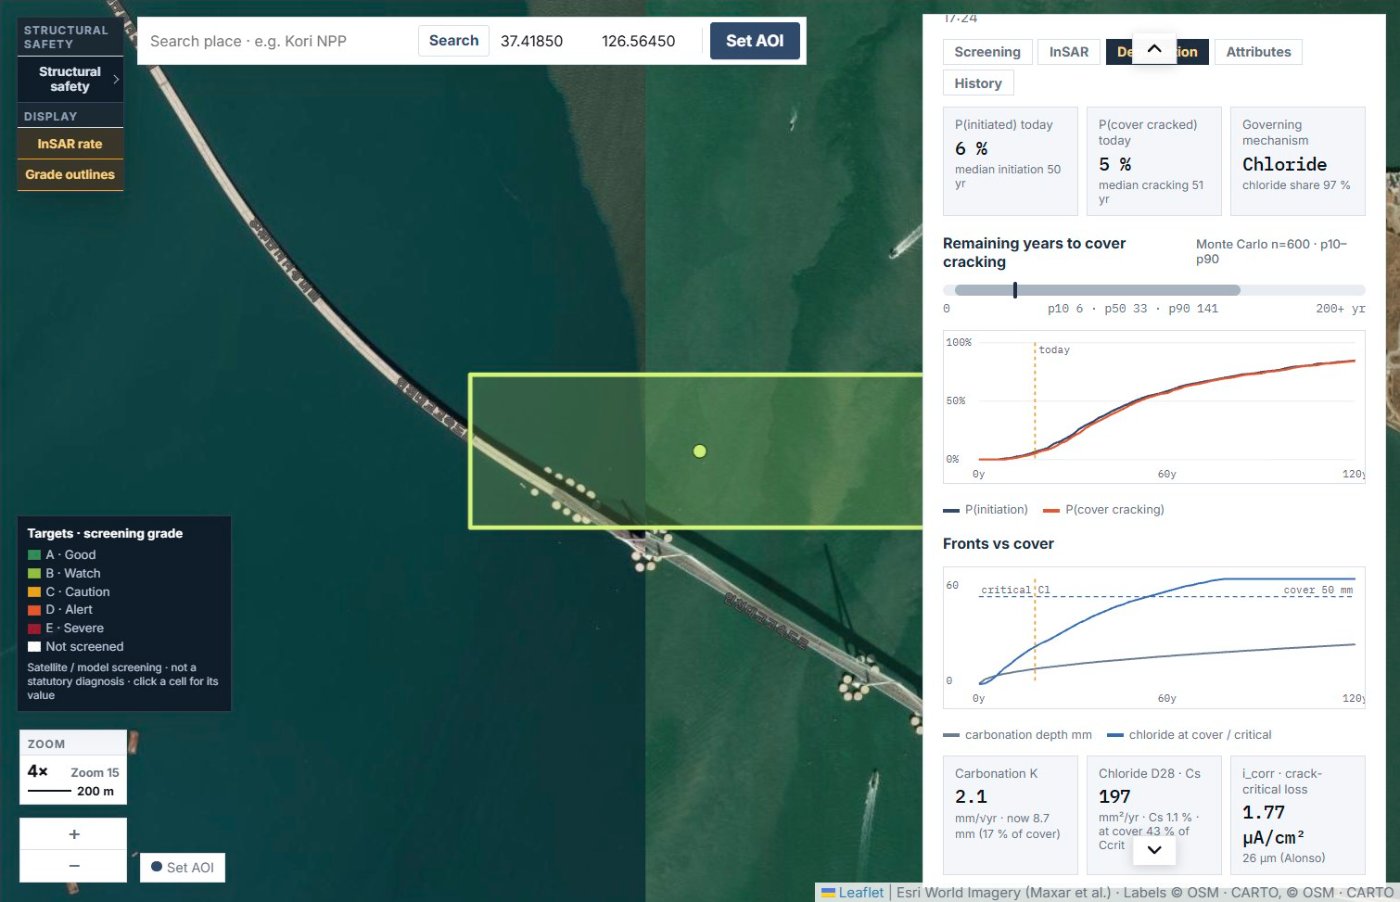
Real cover thickness varies along a member, and so do diffusion coefficients and surface chloride. A single date would hide that. PILLAR samples the inputs 600 times and reports the distribution: p10 (an early case), p50 (the median) and p90 (a late case).
In the demo workspace, the Incheon Bridge main span gives a median of 33 years to cover cracking, with p10 at 6 years and p90 at 141 years, and chloride as the governing mechanism. The wide range is the message: it tells the owner that measured cover and chloride profiles would narrow the answer a lot.
What narrows the range
Typical value for the type
Measured cover
Assumed strength
Core or rebound results
Exposure class
Measured chloride profile
Wide p10–p90 band
Narrower band, better ranking
From a model to an inspection plan
The point of modelling remaining life is not to predict a failure date. It is to rank members and structures, and to show which measurement would reduce uncertainty most. A wide band with chloride governing suggests cover and chloride tests at the splash zone; a narrow band with a short median suggests bringing the detailed inspection forward.
So far we have looked at how coastal concrete ages and how to read remaining life as a range. You can read more on the Degradation AI page.
Frequently asked questions
What is the critical chloride content?
It is the chloride level at the rebar at which corrosion is expected to start. Values depend on the standard and the concrete; models treat it as uncertain.
Does carbonation matter near the sea?
Yes, but in wet marine exposure chloride usually governs. In dry, sheltered parts of a structure carbonation can matter more.
Can a model replace core samples?
No. Models help decide where to take cores and tests; measured values then replace the defaults.
Not sure which structure to inspect first?
We can start with a screening of your structures from public satellite and climate data.
Request a pilot →Edited and answered by the MomentCube PILLAR team / james@momentcube.com · +82-32-212-1011