Material degradation AI, with the formulas showing.
Physics-based models of carbonation, chloride ingress, corrosion and freeze–thaw, run 600 times to give probabilities and remaining life.
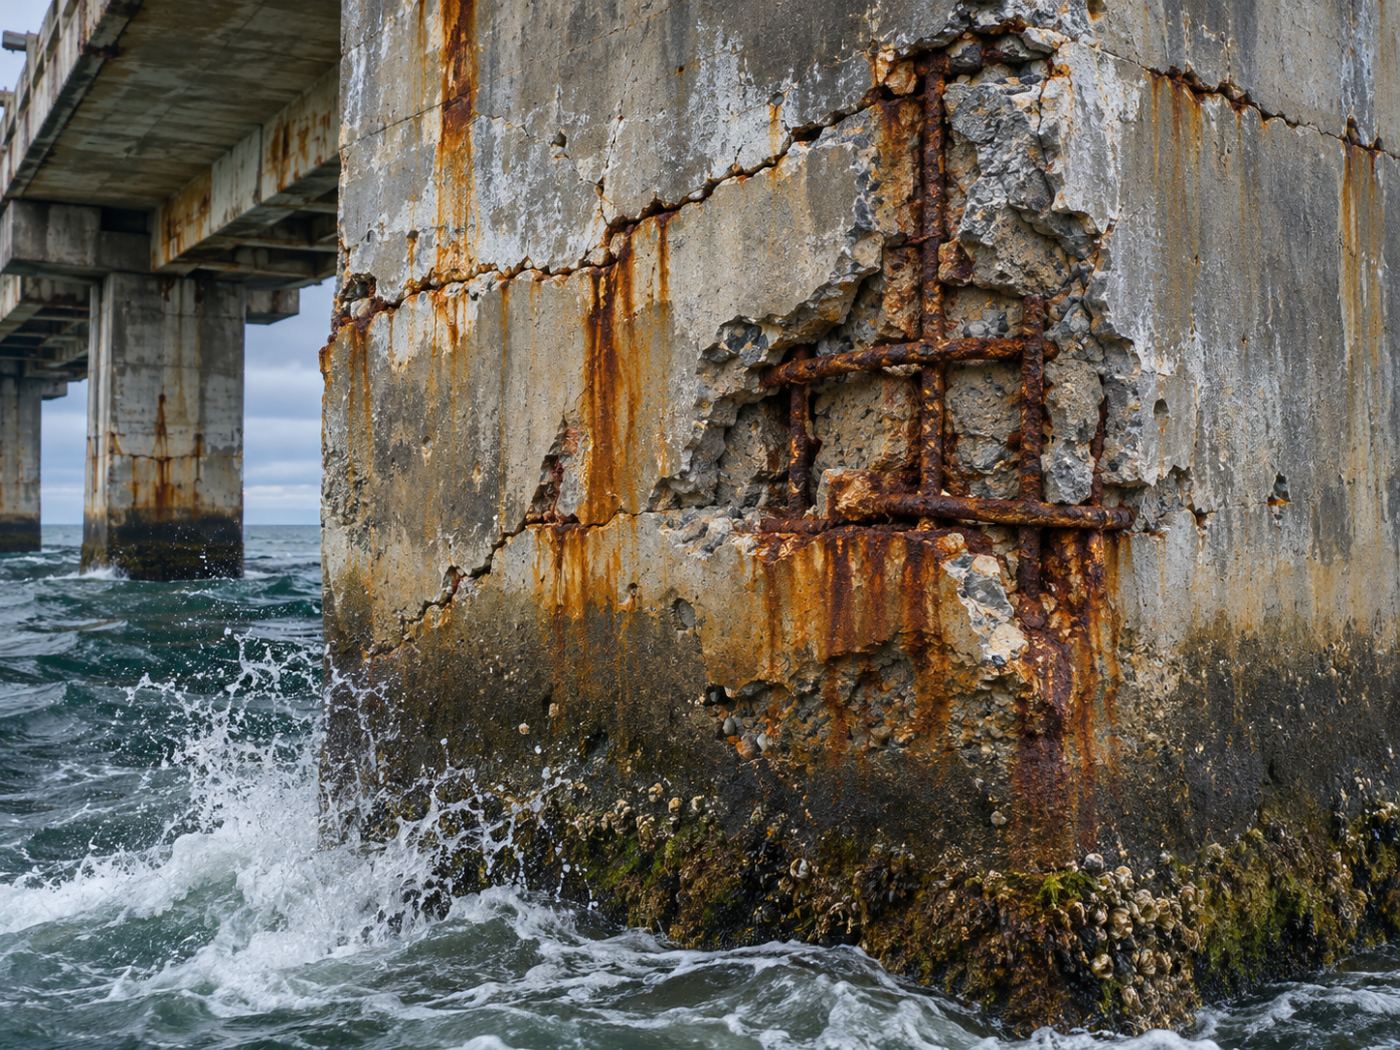
What it models
Five mechanisms that age concrete and steel.
PILLAR takes the site’s climate from ERA5 and the structure’s attributes (year built, concrete strength, cover, distance to the sea) and runs established engineering models. Unknown inputs start from defaults for the structure type.
- Carbonation: fib Model Code 2010
- Chloride ingress: Fick’s second law
- Corrosion propagation and cover cracking: Alonso crack criterion
- Freeze–thaw accumulation
- Atmospheric corrosion: ISO 9223/9224 corrosivity classes
Uncertainty
A range, not a single number.
Material properties vary. PILLAR samples inputs 600 times (Monte Carlo) and reports today’s probabilities and the remaining life as p10, p50 and p90.
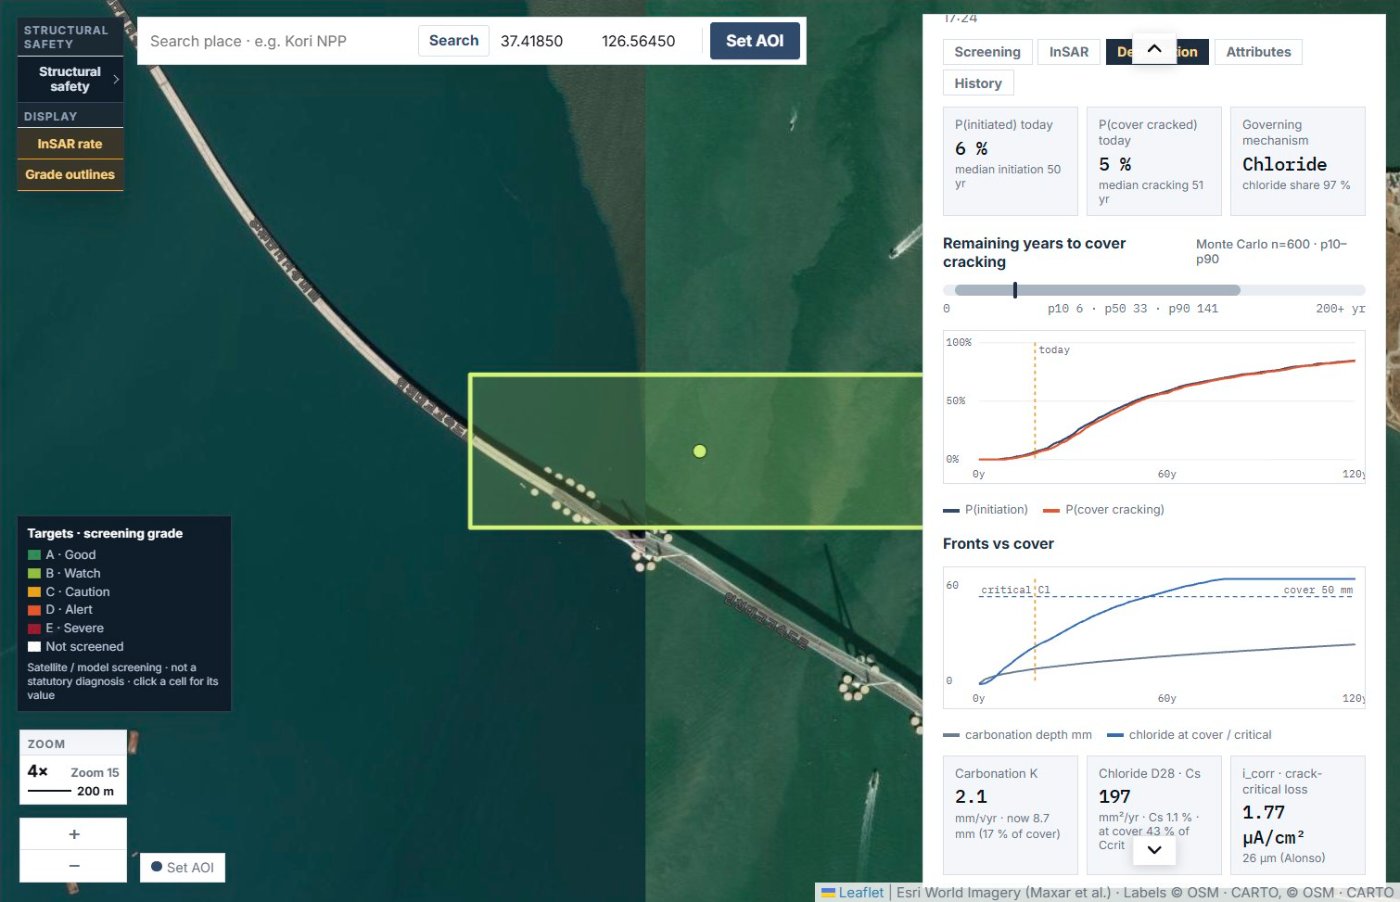
Example: Incheon Bridge main span (demo)
- Corrosion initiation probability today 6%, cover cracking 5%
- Remaining years to cover cracking p50 33 (p10 6 · p90 141)
- Governing mechanism: chloride (97% share)
- Inputs: fck 40 MPa, cover 50 mm, 0 km to the sea, salinity S3
- Climate (ERA5, 2 years): 13 °C, 70% humidity, 1,249 mm/yr rain, 41 freeze–thaw cycles/yr, ISO C4
Model output in the demo account, for illustration. Not an inspection finding.
FAQ
Frequently asked questions
Is this a generative AI model?
No. The degradation calculation uses published engineering models and a Monte Carlo ensemble, and the draft brief arranges those results in a fixed format. Every number carries its source and formula.
What if we have field measurements?
Store measured cover, compressive strength and chloride profiles per structure, and the model uses them instead of the defaults.
Related pages
Work with us
Start with a screening pilot.
No equipment on site. We screen your structures from public satellite and climate data first, then compare the priority list with your own inspection and survey results.