Freeze–thaw damage, how cold winters wear dam and spillway concrete
If you manage dams, spillways or bridges in a cold region, one of the quietest causes of surface deterioration is freeze–thaw damage.
Concrete in cold climates goes through the same test every winter. Water soaks into the pores during wet periods, freezes when the temperature drops, and thaws again when it rises. On a dam face or a spillway chute this can happen dozens of times in a single season, often on the same day for weeks at a time.
Each cycle does a little damage, and the damage adds up. Surfaces start to scale, edges and joints lose material, and the protective layer over the reinforcement gets thinner. Because the change is gradual and spread over large areas, it can go unnoticed until a routine inspection finds a larger repair than expected.
Below we explain how freezing and thawing damage concrete, which conditions make it worse, how climate data helps estimate exposure for each site and how PILLAR uses it to rank structures. If you are planning post-winter inspections, take a look.
Category: Technology
Freeze–thaw damage comes from water expanding inside concrete
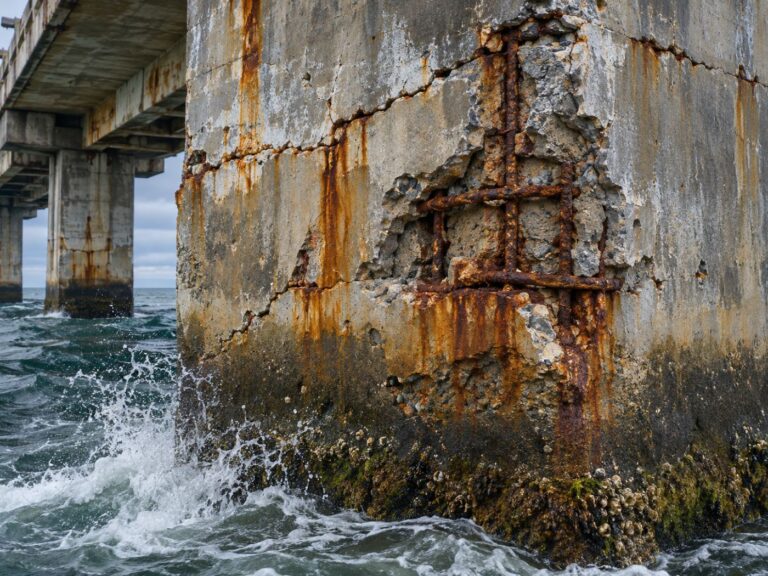
When water freezes it expands by about nine percent. Inside the small pores of saturated concrete there is little room for that expansion, so pressure builds up in the cement paste. Repeated many times, the pressure opens microcracks near the surface, and the outer layer gradually breaks away. Engineers call this surface scaling.
Saturation is the key condition. Dry concrete can freeze without much harm, while concrete that is wet when it freezes suffers far more. That is why spillways, splash zones, horizontal surfaces where water collects and joints that let water in are usually the first places to show damage.
De-icing salts and seawater make matters worse. Salt increases the water held in the surface layer and adds chloride that can later reach the rebar, so freeze–thaw damage and chloride-induced corrosion often work together on cold coastal structures.
How freeze–thaw damages concrete
Water fills pores during wet periods.
Ice expands by about 9% and builds pressure.
Water moves deeper into new microcracks.
After many cycles the surface scales away.
Simplified sequence. Salt and saturation make each cycle more damaging.
Climate data shows how many cycles each structure faces
The number of freeze–thaw cycles depends on the site, not on the concrete. A dam in a mountain valley may see far more cycles than a bridge on a mild coast, even if both were built to the same specification. Knowing the exposure of each structure is therefore the first step in ranking them.
Hourly temperature and moisture records are not available at every structure, but reanalysis data fills that gap. The ERA5 reanalysis from the Copernicus Climate Change Service provides consistent climate data worldwide, from which PILLAR estimates freeze–thaw cycles per year, temperature, humidity and rain for each site.
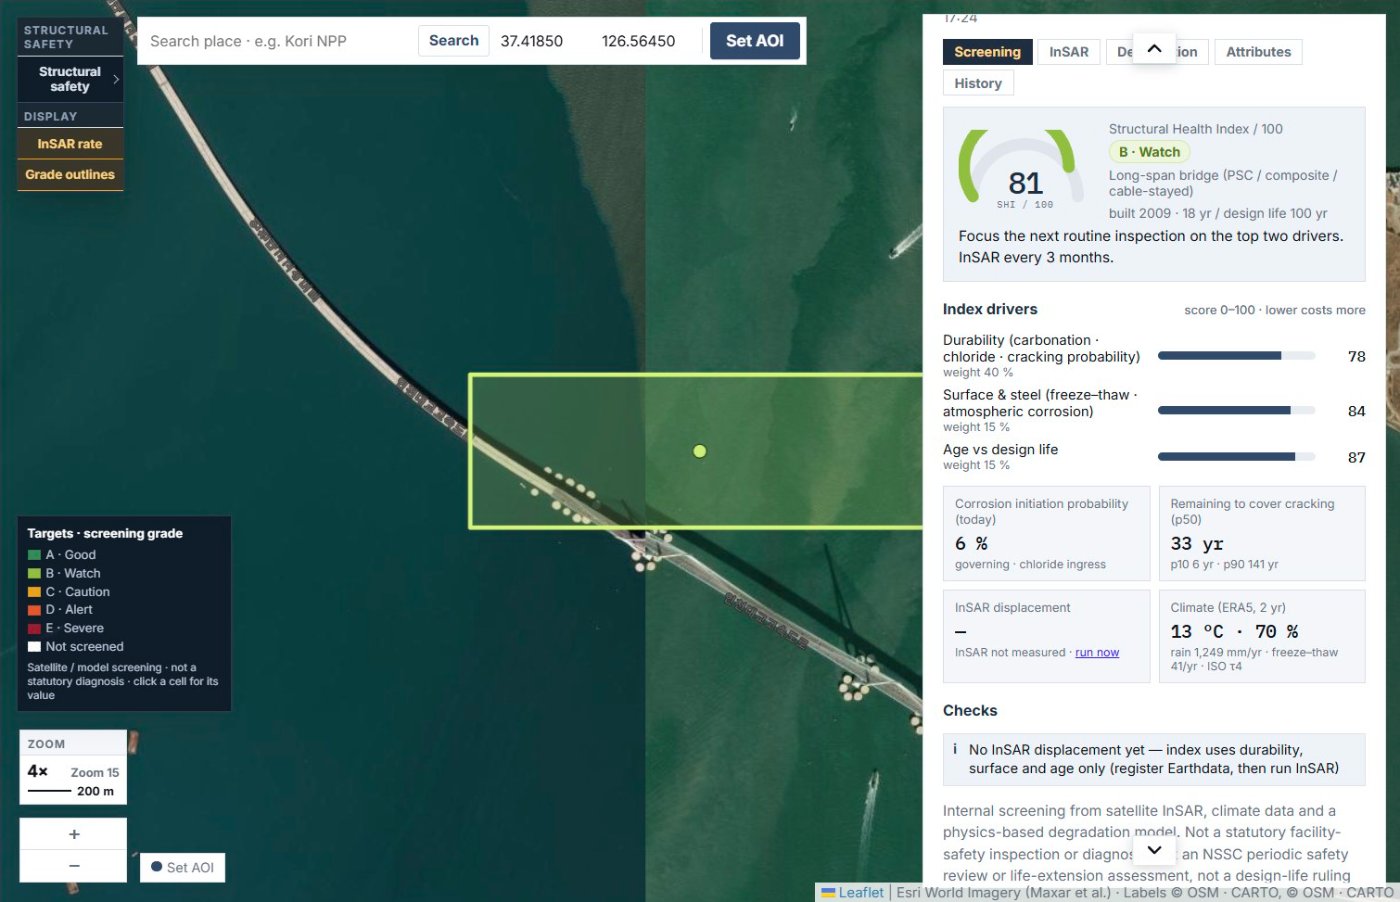
In the demo workspace, the Incheon Bridge site comes out at about 41 freeze–thaw cycles a year from two years of ERA5 data. A dam in a colder inland valley would typically show more, which is exactly the kind of difference a portfolio ranking should reflect.
Freeze–thaw damage on dams shows first at the spillway and the waterline
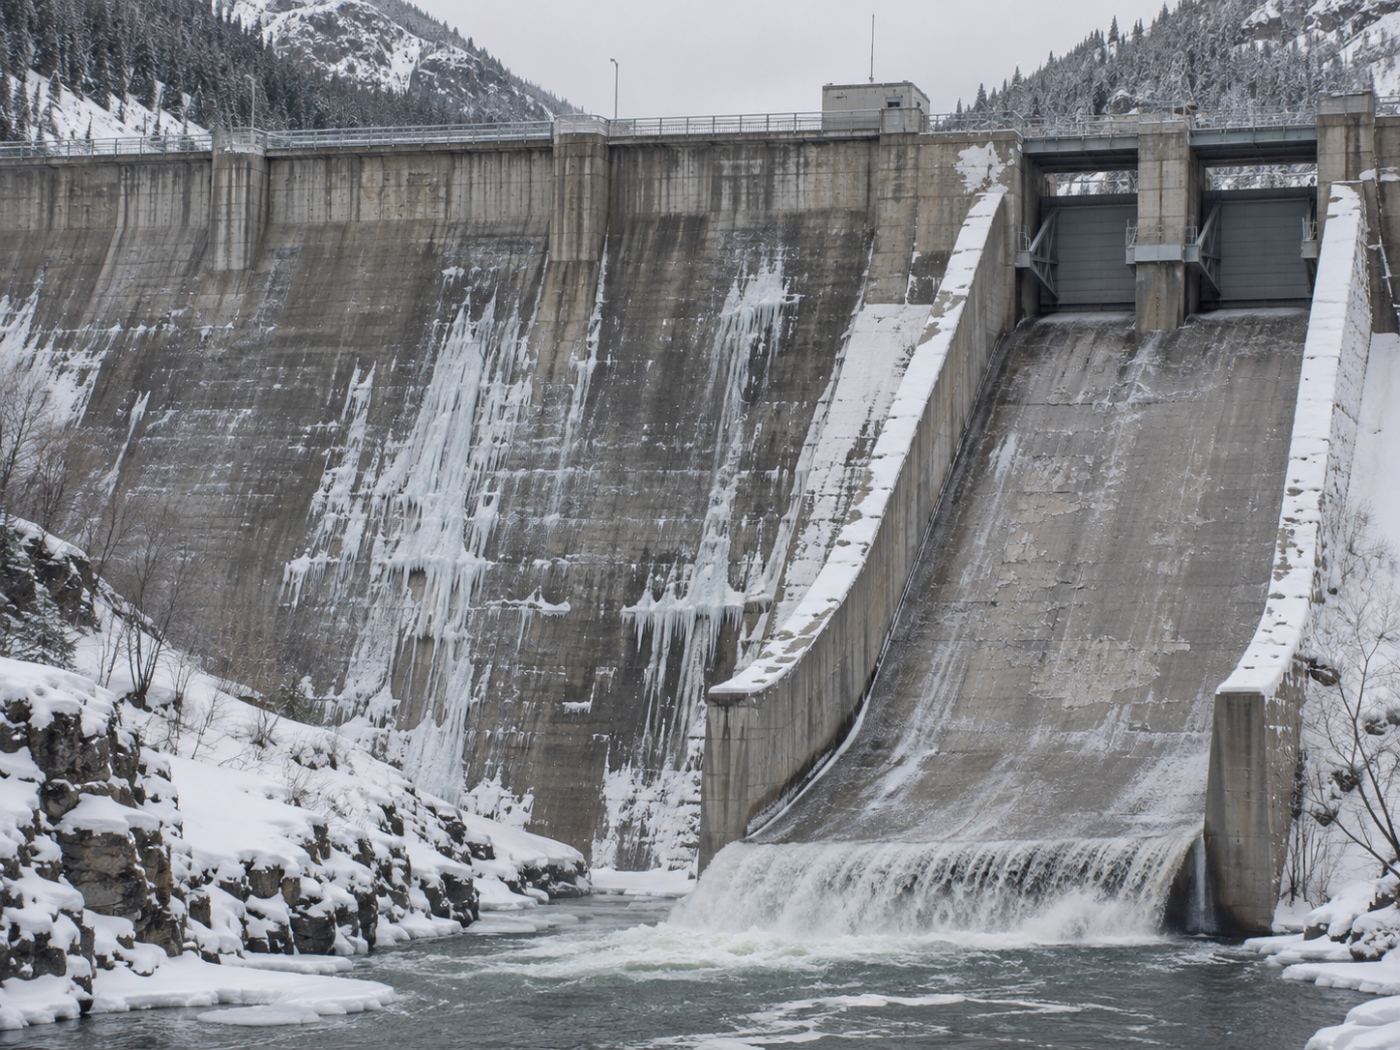
Dams combine large concrete volumes, water and long service lives. The spillway chute and walls are often wet, exposed to fast-flowing water and hit by spray, while the upstream face near the waterline is repeatedly saturated. These are the zones where scaling and loss of cover tend to appear first.
Settlement matters too. A dam body that settles faster than its design allows can open joints and let more water into the concrete, which in turn speeds up freeze–thaw damage. Looking at displacement and surface deterioration together gives a more complete picture than either alone.
The fib Model Code for concrete structures and national standards describe how concrete quality, air entrainment and cover protect against frost. Structures built before modern practice, or repaired with mixed materials, deserve particular attention when exposure is high.
PILLAR uses the freeze–thaw index to decide where to look after winter
In PILLAR, the freeze–thaw index is part of the surface and steel score, which carries 15 percent of the Structural Health Index. Dam bodies are also checked against a settlement screen of 3 mm/yr with an angular distortion of 1/1000.
When the freeze–thaw index is high for a structure, the action queue suggests a specific check, for example looking for surface scaling on the spillway at the next routine inspection. In the demo workspace, the Soyang River Dam body appears in the action queue for exactly this reason.
These suggestions help the inspection team plan where to spend time after winter. They do not replace a dam safety inspection, and the results are labelled as internal screening on every screen and report.
So far we have explained how freeze–thaw damage builds up on dams and spillways and how climate data helps rank them, and you can find more on the Dams and spillways page.
Frequently asked questions
Which parts of a dam should be checked first?
Usually the spillway chute and walls, the upstream face near the waterline and joints where water collects, because they are wet most often.
Can satellites see surface scaling?
Not directly. Radar satellites measure movement, not texture. PILLAR estimates exposure from climate data and suggests where to look; inspectors confirm the condition.
Does air-entrained concrete solve the problem?
It helps a lot, but saturation, salt and older repairs can still cause damage. Exposure and age still matter.
Not sure which structure to inspect first?
We can start with a screening of your structures from public satellite and climate data.
Request a pilot →Edited and answered by the MomentCube PILLAR team / james@momentcube.com · +82-32-212-1011